Average Rent in Farmers Branch, TX
8 apartment buildings, 153 units. Real asking prices, refreshed daily.
Avg Rent
$1,871/mo
Cheapest
$1,126/mo
Properties
8
Units
153
Analysis
Rent Price Breakdown
Compare pricing across all 8 properties in Farmers Branch, TX.
Average Rent by Property
Starting Price vs Average
Rent by Bedroom Count
Price per Square Foot
Farmers Branch, TX Rent Prices
All 8 properties ranked by lowest available rent.
Sola Galleria
13301 Galleria Pl, Farmers Branch, TX 75244, USA
Lakeview at Parkside
3950 Spring Valley Rd, Farmers Branch, TX 75244, USA
Midway Urban Village
4050 McEwen Rd, Farmers Branch, TX 75244, USA
Alvista Galleria
13505 Inwood Rd, Farmers Branch, TX 75244, USA
Prairie Crossing
4000 Sigma Rd, Farmers Branch, TX 75244, USA
Cortland Galleria
5005 Galleria Dr, Farmers Branch, TX 75244, USA
Chateau de Ville
4040 Spring Valley Rd, Farmers Branch, TX 75244, USA
| # | Property | From | Avg | $/sqft | Rating | Units |
|---|---|---|---|---|---|---|
| 1 | Sola Galleria 13301 Galleria Pl, Farmers Branch, TX 75244, USA | $1,126 | $1,687 | $1.91 | 3.6 (206) | 32 |
| 2 | Lakeview at Parkside 3950 Spring Valley Rd, Farmers Branch, TX 75244, USA | $1,169 | $1,538 | $1.66 | 3.2 (227) | 25 |
| 3 | Midway Urban Village 4050 McEwen Rd, Farmers Branch, TX 75244, USA | $1,305 | $2,303 | $2.20 | 4 (142) | 21 |
| 4 | Alvista Galleria 13505 Inwood Rd, Farmers Branch, TX 75244, USA | $1,315 | $1,849 | $1.91 | 3.7 (189) | 10 |
| 5 | Prairie Crossing 4000 Sigma Rd, Farmers Branch, TX 75244, USA | $1,345 | $1,690 | $1.79 | 3.5 (308) | 23 |
| 6 | Cortland Galleria 5005 Galleria Dr, Farmers Branch, TX 75244, USA | $1,400 | $2,292 | $1.90 | 4.3 (356) | 25 |
| 7 | Chateau de Ville 4040 Spring Valley Rd, Farmers Branch, TX 75244, USA | $1,458 | $1,750 | $1.72 | 2.8 (74) | 12 |
Explore Each Property
Sola Galleria
3.6 (206)13301 Galleria Pl, Farmers Branch, TX 75244, USA
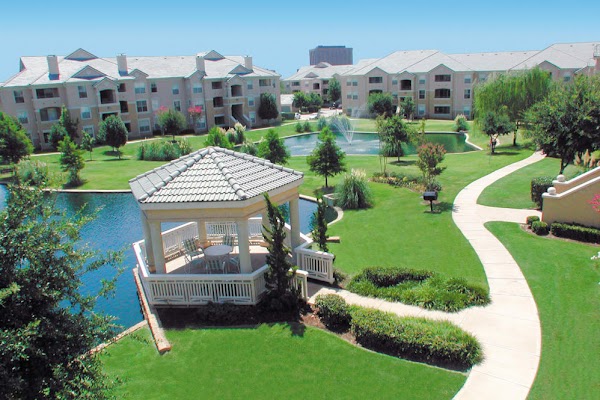
Lakeview at Parkside
3.2 (227)3950 Spring Valley Rd, Farmers Branch, TX 75244, USA
Midway Urban Village
4 (142)4050 McEwen Rd, Farmers Branch, TX 75244, USA
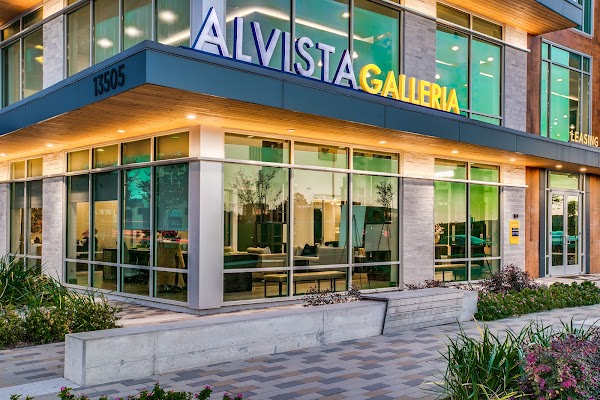
Alvista Galleria
3.7 (189)13505 Inwood Rd, Farmers Branch, TX 75244, USA
Prairie Crossing
3.5 (308)4000 Sigma Rd, Farmers Branch, TX 75244, USA
Cortland Galleria
4.3 (356)5005 Galleria Dr, Farmers Branch, TX 75244, USA
Farmers Branch, TX Average Rent Prices 2026
The average rent in Farmers Branch, TX is $1,871 per month, based on 153 units across 8 apartment communities. Prices range from $1,126 at Sola Galleria to $1,642 at Villas at Parkside.
Average Rent by Bedroom Type
| Type | Avg Rent | Starting From | Units |
|---|---|---|---|
| Studio | $1,397/mo | $1,305/mo | 2 |
| 1 Bed | $1,576/mo | $1,126/mo | 81 |
| 2 Bed | $2,160/mo | $1,422/mo | 66 |
| 3 Bed | $3,318/mo | $2,460/mo | 4 |
Every price comes directly from each property's leasing system, updated that morning. Request a neighborhood we don't cover and we add it within 24 hours.
Market Context
Who rents in Farmers Branch, TX, and what they pay
Tracked one-bedroom rent in Farmers Branch, TX averages $1,576/mo, with two-bedroom units averaging $2,160/mo. At the local median household income of $87,702, that works out to 26% of gross income, near the 30 percent affordability ceiling.
The U.S. Census Bureau's American Community Survey 2023 release pegged median gross rent in Farmers Branch, TX at $1,820/mo. The current tracked market average runs 3% higher than that benchmark, reflecting both two to three years of rent growth and the fact that the Census figure covers all renter-occupied housing in Farmers Branch, TX while the tracked market average covers units currently listed in larger apartment communities.
What salary do I need to live comfortably in Farmers Branch, TX?
Built on the 25 to 30 percent rent-to-income guideline used by most landlords and credit-scoring models.
Minimum to afford average rent
$75,000/year
30 percent rule -- using our average rent of $1,871/mo.
Comfortable income
$90,000/year
25 percent rule -- leaves more room for savings, transport, and groceries.
To afford the cheapest tracked apartment ($1,126/mo), you need to earn at least $45,000/year.
Median household income in Farmers Branch, TX is $87,702 , about 2% below the comfortable-living threshold.
Cost of living in Farmers Branch, TX
Overall prices in Farmers Branch, TX runs above the national average by about 2% (BEA Regional Price Parity index 102.5, where 100 equals the U.S. average). The breakdown below estimates monthly costs for a single adult, using national consumer-spending baselines from the Bureau of Labor Statistics scaled by Farmers Branch, TX's regional price parities.
| Category | Monthly estimate |
|---|---|
| Rent (market average) | $1,871 |
| Utilities | $507 |
| Groceries | $560 |
| Transportation | $1,208 |
| Healthcare | $589 |
| Other goods and services | $943 |
| Estimated total | $5,677/mo |
Population
36,254
Median household income
$87,702
Census median rent
$1,820/mo
Rent as % of income
27.0%
Median age
33.5
Mean commute
23 min
Methodology
Rent data
Sourced directly from each tracked apartment community and refreshed every 24 hours. Every listed unit price on this page is real and listed today.
Cost of living
Estimates combine national consumer-spending baselines from the U.S. Bureau of Labor Statistics (Consumer Expenditure Survey) with the U.S. Bureau of Economic Analysis Regional Price Parities (MARPP dataset). Both are peer-reviewed federal data releases published annually.
Salary to live comfortably
Applies the standard 25 to 30 percent rent-to-income rule on top of the listed rent. This is the same affordability guideline used by most landlords and credit-scoring models.
Demographic figures
Median household income, population, median age, commute time, Census median rent, and rent as percentage of income come from the U.S. Census Bureau's American Community Survey 5-year estimates, the most recent complete release.
Cost of living and demographic figures were last published in 2023.
Compare
Nearby cities in Texas
How Farmers Branch, TX rent compares to other markets in the state.
| City | Avg Rent | vs Farmers Branch, TX | Properties |
|---|---|---|---|
| Austin, TX | $2,013 | +8% | 200 |
| Dallas, TX | $1,770 | -5% | 151 |
| Addison, TX | $1,857 | -1% | 146 |
| Houston, TX | $2,269 | +21% | 75 |
| Lewisville, TX | $1,627 | -13% | 50 |
| San Antonio, TX | $2,033 | +9% | 39 |
Frequently asked questions
What is the average rent in Farmers Branch, TX?
The average rent in Farmers Branch, TX is $1,871 per month, based on 153 units across 8 apartment buildings tracked by Average Rent. Prices are updated every morning through our proprietary data sourcing.
What is the cheapest apartment rent in Farmers Branch, TX?
The lowest available rent in Farmers Branch, TX starts at $1,126 per month. Availability changes daily as leasing data is refreshed each morning.
How much is a 1-bedroom apartment in Farmers Branch, TX?
1-bedroom apartments in Farmers Branch, TX average $1,576/mo. The lowest listed 1-bedroom starts at $1,126/mo across 81 units tracked.
How much is a 2-bedroom apartment in Farmers Branch, TX?
2-bedroom apartments in Farmers Branch, TX average $2,160/mo. Units start from $1,422/mo across 66 units currently listed.
Rent Trends in Farmers Branch, TX
Track how apartment prices are changing over time.
Missing your neighborhood?
Tell us where you're looking. We'll start tracking prices within 24 hours.
Get Started