Average Rent in Rancho Cucamonga, CA
13 apartment buildings, 169 units. Real asking prices, refreshed daily.
Avg Rent
$2,854/mo
Cheapest
$2,098/mo
Properties
13
Units
169
Analysis
Rent Price Breakdown
Compare pricing across all 13 properties in Rancho Cucamonga, CA.
Average Rent by Property
Starting Price vs Average
Rent by Bedroom Count
Price per Square Foot
Rancho Cucamonga, CA Rent Prices
All 13 properties ranked by lowest available rent.
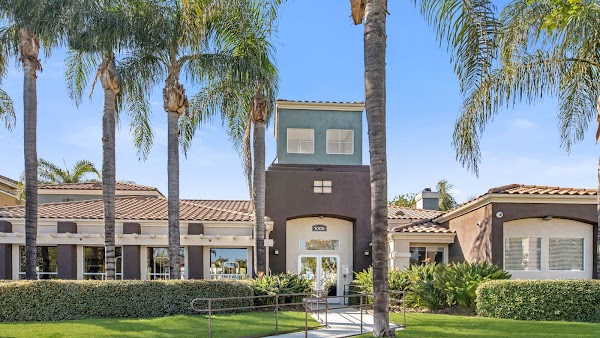
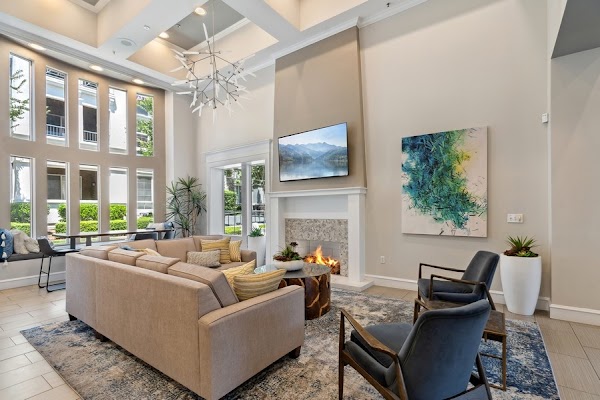
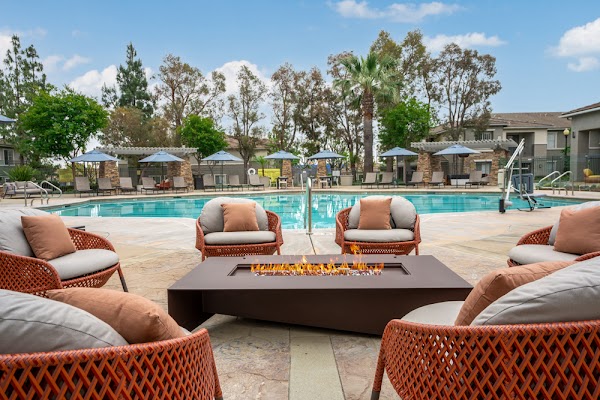
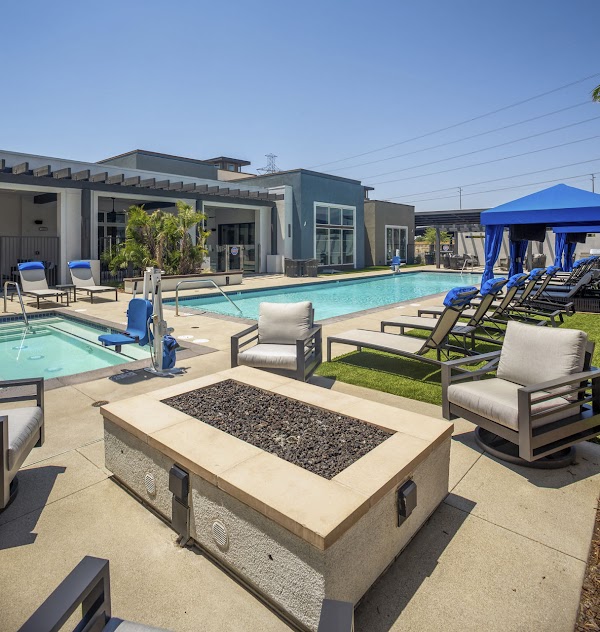
Centre Club Apartments
1005 N Center Ave, Ontario, CA 91764, USA
Ironwood
11100 Fourth St, Rancho Cucamonga, CA 91730, USA
The Reserve at Empire Lakes Apartments
11210 Fourth St, Rancho Cucamonga, CA 91730, USA
Victoria Arbors Apartment Homes
7922 Day Creek Blvd, Rancho Cucamonga, CA 91739, USA
Camino Real Apartments home
7951 Etiwanda Ave, Rancho Cucamonga, CA 91739, USA
Camden Landmark Apartments
950 Duesenberg Dr, Ontario, CA 91764, USA
The Core on Foothill
13250 Foothill Blvd, Rancho Cucamonga, CA 91739, USA
| # | Property | From | Avg | $/sqft | Rating | Units |
|---|---|---|---|---|---|---|
| 1 | Centre Club Apartments 1005 N Center Ave, Ontario, CA 91764, USA | $2,098 | $2,436 | $2.62 | 4.5 (201) | 16 |
| 2 | Ironwood 11100 Fourth St, Rancho Cucamonga, CA 91730, USA | $2,216 | $2,723 | $2.81 | 4.2 (337) | 46 |
| 3 | The Reserve at Empire Lakes Apartments 11210 Fourth St, Rancho Cucamonga, CA 91730, USA | $2,239 | $2,472 | $2.79 | 4.5 (264) | 13 |
| 4 | Victoria Arbors Apartment Homes 7922 Day Creek Blvd, Rancho Cucamonga, CA 91739, USA | $2,306 | $2,734 | $2.67 | 4 (156) | 6 |
| 5 | Camino Real Apartments home 7951 Etiwanda Ave, Rancho Cucamonga, CA 91739, USA | $2,311 | $2,997 | $3.00 | 4.2 (169) | 5 |
| 6 | Camden Landmark Apartments 950 Duesenberg Dr, Ontario, CA 91764, USA | $2,329 | $2,416 | $2.70 | 4 (250) | 18 |
| 7 | The Core on Foothill 13250 Foothill Blvd, Rancho Cucamonga, CA 91739, USA | $2,609 | $3,174 | $3.22 | 4.3 (69) | 7 |
Explore Each Property
Centre Club Apartments
4.5 (201)1005 N Center Ave, Ontario, CA 91764, USA

Ironwood
4.2 (337)11100 Fourth St, Rancho Cucamonga, CA 91730, USA

The Reserve at Empire Lakes Apartments
4.5 (264)11210 Fourth St, Rancho Cucamonga, CA 91730, USA
Victoria Arbors Apartment Homes
4 (156)7922 Day Creek Blvd, Rancho Cucamonga, CA 91739, USA
Camino Real Apartments home
4.2 (169)7951 Etiwanda Ave, Rancho Cucamonga, CA 91739, USA

Camden Landmark Apartments
4 (250)950 Duesenberg Dr, Ontario, CA 91764, USA

Rancho Cucamonga, CA Average Rent Prices 2026
The average rent in Rancho Cucamonga, CA is $2,854 per month, based on 169 units across 13 apartment communities. Prices range from $2,098 at Centre Club Apartments to $2,930 at Rancho Vista.
Average Rent by Bedroom Type
| Type | Avg Rent | Starting From | Units |
|---|---|---|---|
| Studio | $3,395/mo | $3,320/mo | 6 |
| 1 Bed | $2,572/mo | $2,098/mo | 80 |
| 2 Bed | $2,980/mo | $2,216/mo | 66 |
| 3 Bed | $3,503/mo | $2,719/mo | 17 |
Every price comes directly from each property's leasing system, updated that morning. Request a neighborhood we don't cover and we add it within 24 hours.
Market Context
Who rents in Rancho Cucamonga, CA, and what they pay
Tracked one-bedroom rent in Rancho Cucamonga, CA averages $2,572/mo, with two-bedroom units averaging $2,980/mo. At the local median household income of $109,511, that works out to 31% of gross income, above the 30 percent affordability ceiling, a stretched-budget market.
The U.S. Census Bureau's American Community Survey 2023 release pegged median gross rent in Rancho Cucamonga, CA at $2,286/mo. The current tracked market average runs 25% higher than that benchmark, reflecting both two to three years of rent growth and the fact that the Census figure covers all renter-occupied housing in Rancho Cucamonga, CA while the tracked market average covers units currently listed in larger apartment communities.
What salary do I need to live comfortably in Rancho Cucamonga, CA?
Built on the 25 to 30 percent rent-to-income guideline used by most landlords and credit-scoring models.
Minimum to afford average rent
$114,000/year
30 percent rule -- using our average rent of $2,854/mo.
Comfortable income
$137,000/year
25 percent rule -- leaves more room for savings, transport, and groceries.
To afford the cheapest tracked apartment ($2,098/mo), you need to earn at least $84,000/year.
Median household income in Rancho Cucamonga, CA is $109,511 , about 20% below the comfortable-living threshold.
Cost of living in Rancho Cucamonga, CA
Overall prices in Rancho Cucamonga, CA runs above the national average by about 7% (BEA Regional Price Parity index 107.3, where 100 equals the U.S. average). The breakdown below estimates monthly costs for a single adult, using national consumer-spending baselines from the Bureau of Labor Statistics scaled by Rancho Cucamonga, CA's regional price parities.
| Category | Monthly estimate |
|---|---|
| Rent (market average) | $2,854 |
| Utilities | $567 |
| Groceries | $551 |
| Transportation | $1,353 |
| Healthcare | $660 |
| Other goods and services | $1,056 |
| Estimated total | $7,040/mo |
Population
174,693
Median household income
$109,511
Census median rent
$2,286/mo
Rent as % of income
33.4%
Median age
37.9
Mean commute
32 min
Methodology
Rent data
Sourced directly from each tracked apartment community and refreshed every 24 hours. Every listed unit price on this page is real and listed today.
Cost of living
Estimates combine national consumer-spending baselines from the U.S. Bureau of Labor Statistics (Consumer Expenditure Survey) with the U.S. Bureau of Economic Analysis Regional Price Parities (MARPP dataset). Both are peer-reviewed federal data releases published annually.
Salary to live comfortably
Applies the standard 25 to 30 percent rent-to-income rule on top of the listed rent. This is the same affordability guideline used by most landlords and credit-scoring models.
Demographic figures
Median household income, population, median age, commute time, Census median rent, and rent as percentage of income come from the U.S. Census Bureau's American Community Survey 5-year estimates, the most recent complete release.
Cost of living and demographic figures were last published in 2023.
Compare
Nearby cities in California
How Rancho Cucamonga, CA rent compares to other markets in the state.
| City | Avg Rent | vs Rancho Cucamonga, CA | Properties |
|---|---|---|---|
| Los Angeles, CA | $2,872 | +1% | 46 |
| San Diego, CA | $3,210 | +12% | 25 |
| Sacramento, CA | $2,284 | -20% | 25 |
| Riverside, CA | $2,536 | -11% | 25 |
| Anaheim, CA | $2,749 | -4% | 22 |
| Oakland, CA | $3,349 | +17% | 21 |
Frequently asked questions
What is the average rent in Rancho Cucamonga, CA?
The average rent in Rancho Cucamonga, CA is $2,854 per month, based on 169 units across 13 apartment buildings tracked by Average Rent. Prices are updated every morning through our proprietary data sourcing.
What is the cheapest apartment rent in Rancho Cucamonga, CA?
The lowest available rent in Rancho Cucamonga, CA starts at $2,098 per month. Availability changes daily as leasing data is refreshed each morning.
How much is a 1-bedroom apartment in Rancho Cucamonga, CA?
1-bedroom apartments in Rancho Cucamonga, CA average $2,572/mo. The lowest listed 1-bedroom starts at $2,098/mo across 80 units tracked.
How much is a 2-bedroom apartment in Rancho Cucamonga, CA?
2-bedroom apartments in Rancho Cucamonga, CA average $2,980/mo. Units start from $2,216/mo across 66 units currently listed.
Rent Trends in Rancho Cucamonga, CA
Track how apartment prices are changing over time.
Missing your neighborhood?
Tell us where you're looking. We'll start tracking prices within 24 hours.
Get Started