Average Rent in Huntington Beach, CA
14 apartment buildings, 59 units. Real asking prices, refreshed daily.
Avg Rent
$3,110/mo
Cheapest
$2,250/mo
Properties
14
Units
59
Analysis
Rent Price Breakdown
Compare pricing across all 14 properties in Huntington Beach, CA.
Average Rent by Property
Starting Price vs Average
Rent by Bedroom Count
Price per Square Foot
Huntington Beach, CA Rent Prices
All 14 properties ranked by lowest available rent.
Sail Properties
315 3rd St D, Huntington Beach, CA 92648, USA
Ocean Breeze Villas
6401 Warner Ave, Huntington Beach, CA 92647, USA
Huntington Vista
21551 Brookhurst St, Huntington Beach, CA 92646, USA
Corte Bella Apartments
9580 El Rey Ave, Fountain Valley, CA 92708, USA
Valley Park Apartments
17300 Euclid St, Fountain Valley, CA 92708, USA
Sendero Huntington Beach
8945 Riverbend Dr, Huntington Beach, CA 92647, USA
Newport Palms
1850 Whittier Ave, Costa Mesa, CA 92627, USA
| # | Property | From | Avg | $/sqft | Rating | Units |
|---|---|---|---|---|---|---|
| 1 | Sail Properties 315 3rd St D, Huntington Beach, CA 92648, USA | $2,250 | $3,559 | $2.95 | 4.9 (241) | 5 |
| 2 | Ocean Breeze Villas 6401 Warner Ave, Huntington Beach, CA 92647, USA | $2,292 | $2,837 | $2.97 | 3.4 (143) | 15 |
| 3 | Huntington Vista 21551 Brookhurst St, Huntington Beach, CA 92646, USA | $2,299 | $2,426 | -- | 2.7 (108) | 3 |
| 4 | Corte Bella Apartments 9580 El Rey Ave, Fountain Valley, CA 92708, USA | $2,335 | $2,761 | $3.21 | 3.7 (118) | 12 |
| 5 | Valley Park Apartments 17300 Euclid St, Fountain Valley, CA 92708, USA | $2,547 | $2,746 | $2.68 | 4.2 (93) | 7 |
| 6 | Sendero Huntington Beach 8945 Riverbend Dr, Huntington Beach, CA 92647, USA | $2,756 | $2,756 | $4.45 | 4.3 (64) | 1 |
| 7 | Newport Palms 1850 Whittier Ave, Costa Mesa, CA 92627, USA | $2,968 | $3,344 | $3.76 | 3.9 (116) | 10 |
Explore Each Property

Sail Properties
4.9 (241)315 3rd St D, Huntington Beach, CA 92648, USA
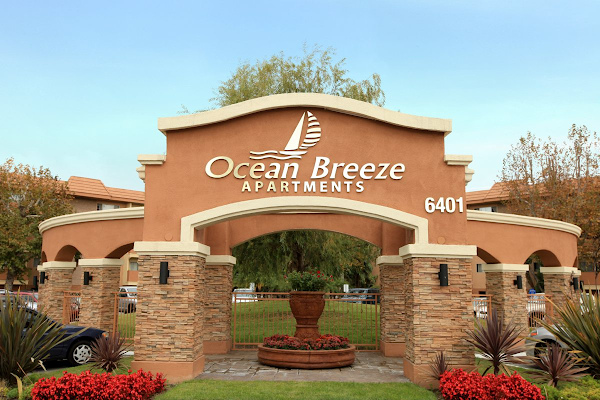
Ocean Breeze Villas
3.4 (143)6401 Warner Ave, Huntington Beach, CA 92647, USA
Huntington Vista
2.7 (108)21551 Brookhurst St, Huntington Beach, CA 92646, USA
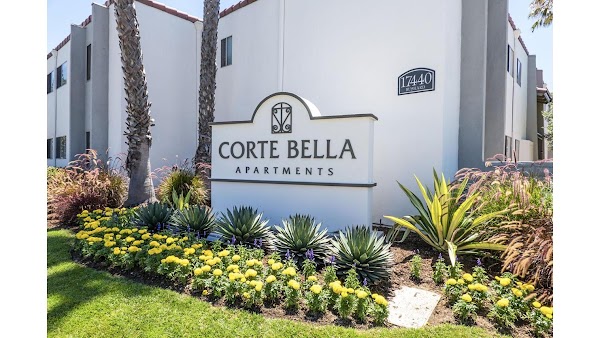
Corte Bella Apartments
3.7 (118)9580 El Rey Ave, Fountain Valley, CA 92708, USA
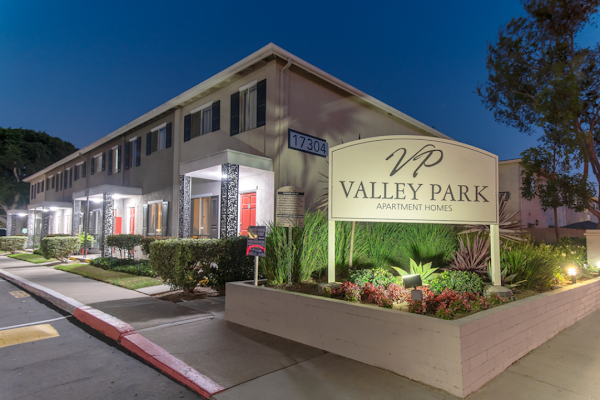
Valley Park Apartments
4.2 (93)17300 Euclid St, Fountain Valley, CA 92708, USA
Sendero Huntington Beach
4.3 (64)8945 Riverbend Dr, Huntington Beach, CA 92647, USA

Huntington Beach, CA Average Rent Prices 2026
The average rent in Huntington Beach, CA is $3,110 per month, based on 59 units across 14 apartment communities. Prices range from $2,250 at Sail Properties to $4,750 at West Point Property Management (Huntington Beach Property Management Company).
Average Rent by Bedroom Type
| Type | Avg Rent | Starting From | Units |
|---|---|---|---|
| 1 Bed | $2,594/mo | $2,250/mo | 15 |
| 2 Bed | $3,116/mo | $2,382/mo | 36 |
| 3 Bed | $3,537/mo | $2,299/mo | 6 |
| 4 Bed | $5,600/mo | $4,750/mo | 2 |
Every price comes directly from each property's leasing system, updated that morning. Request a neighborhood we don't cover and we add it within 24 hours.
Market Context
Who rents in Huntington Beach, CA, and what they pay
Tracked one-bedroom rent in Huntington Beach, CA averages $2,594/mo, with two-bedroom units averaging $3,116/mo. At the local median household income of $119,885, that works out to 31% of gross income, above the 30 percent affordability ceiling, a stretched-budget market.
The U.S. Census Bureau's American Community Survey 2023 release pegged median gross rent in Huntington Beach, CA at $2,424/mo. The current tracked market average runs 28% higher than that benchmark, reflecting both two to three years of rent growth and the fact that the Census figure covers all renter-occupied housing in Huntington Beach, CA while the tracked market average covers units currently listed in larger apartment communities.
Who employs renters in Orange County
Demand in the Orange County rental market is shaped by the metro's largest private and public employers. The following organizations anchor local hiring and influence what renters can pay:
- Boeing
- Quiksilver
- Cambro Manufacturing
Mean one-way commute in Huntington Beach, CA is 29 minutes, per the Census ACS, useful context when weighing which properties sit inside reasonable reach of these employers.
What salary do I need to live comfortably in Huntington Beach, CA?
Built on the 25 to 30 percent rent-to-income guideline used by most landlords and credit-scoring models.
Minimum to afford average rent
$124,000/year
30 percent rule -- using our average rent of $3,110/mo.
Comfortable income
$149,000/year
25 percent rule -- leaves more room for savings, transport, and groceries.
To afford the cheapest tracked apartment ($2,250/mo), you need to earn at least $90,000/year.
Median household income in Huntington Beach, CA is $119,885 , about 20% below the comfortable-living threshold.
Cost of living in Huntington Beach, CA
Overall prices in Huntington Beach, CA runs above the national average by about 15% (BEA Regional Price Parity index 114.7, where 100 equals the U.S. average). The breakdown below estimates monthly costs for a single adult, using national consumer-spending baselines from the Bureau of Labor Statistics scaled by Huntington Beach, CA's regional price parities.
| Category | Monthly estimate |
|---|---|
| Rent (market average) | $3,110 |
| Utilities | $744 |
| Groceries | $578 |
| Transportation | $1,773 |
| Healthcare | $865 |
| Other goods and services | $1,384 |
| Estimated total | $8,454/mo |
Population
196,010
Median household income
$119,885
Census median rent
$2,424/mo
Rent as % of income
30.7%
Median age
43.4
Mean commute
29 min
Methodology
Rent data
Sourced directly from each tracked apartment community and refreshed every 24 hours. Every listed unit price on this page is real and listed today.
Cost of living
Estimates combine national consumer-spending baselines from the U.S. Bureau of Labor Statistics (Consumer Expenditure Survey) with the U.S. Bureau of Economic Analysis Regional Price Parities (MARPP dataset). Both are peer-reviewed federal data releases published annually.
Salary to live comfortably
Applies the standard 25 to 30 percent rent-to-income rule on top of the listed rent. This is the same affordability guideline used by most landlords and credit-scoring models.
Demographic figures
Median household income, population, median age, commute time, Census median rent, and rent as percentage of income come from the U.S. Census Bureau's American Community Survey 5-year estimates, the most recent complete release.
Cost of living and demographic figures were last published in 2023.
Compare
Nearby cities in California
How Huntington Beach, CA rent compares to other markets in the state.
| City | Avg Rent | vs Huntington Beach, CA | Properties |
|---|---|---|---|
| Los Angeles, CA | $2,872 | -8% | 46 |
| San Diego, CA | $3,210 | +3% | 25 |
| Sacramento, CA | $2,284 | -27% | 25 |
| Riverside, CA | $2,536 | -18% | 25 |
| Anaheim, CA | $2,749 | -12% | 22 |
| Oakland, CA | $3,349 | +8% | 21 |
Frequently asked questions
What is the average rent in Huntington Beach, CA?
The average rent in Huntington Beach, CA is $3,110 per month, based on 59 units across 14 apartment buildings tracked by Average Rent. Prices are updated every morning through our proprietary data sourcing.
What is the cheapest apartment rent in Huntington Beach, CA?
The lowest available rent in Huntington Beach, CA starts at $2,250 per month. Availability changes daily as leasing data is refreshed each morning.
How much is a 1-bedroom apartment in Huntington Beach, CA?
1-bedroom apartments in Huntington Beach, CA average $2,594/mo. The lowest listed 1-bedroom starts at $2,250/mo across 15 units tracked.
How much is a 2-bedroom apartment in Huntington Beach, CA?
2-bedroom apartments in Huntington Beach, CA average $3,116/mo. Units start from $2,382/mo across 36 units currently listed.
Rent Trends in Huntington Beach, CA
Track how apartment prices are changing over time.
Missing your neighborhood?
Tell us where you're looking. We'll start tracking prices within 24 hours.
Get Started