Average Rent in New Bedford, MA
7 apartment buildings, 73 units. Real asking prices, refreshed daily.
Avg Rent
$1,101/mo
Cheapest
$737/mo
Properties
7
Units
73
Analysis
Rent Price Breakdown
Compare pricing across all 7 properties in New Bedford, MA.
Average Rent by Property
Starting Price vs Average
Rent by Bedroom Count
Price per Square Foot
New Bedford, MA Rent Prices
All 7 properties ranked by lowest available rent.
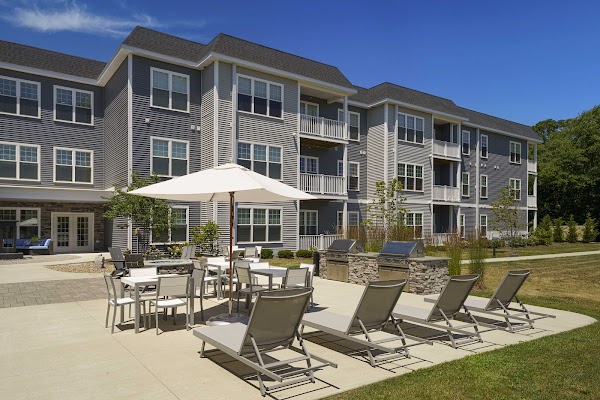
Manomet Place
170 Riverside Ave, New Bedford, MA 02746, USA
Amelia Apartments
676 Dartmouth St, Dartmouth, MA 02748, USA
Buttonwood Apartments
50 Oesting St, New Bedford, MA 02740, USA
Grinnell Mansion
379 County St, New Bedford, MA 02740, USA
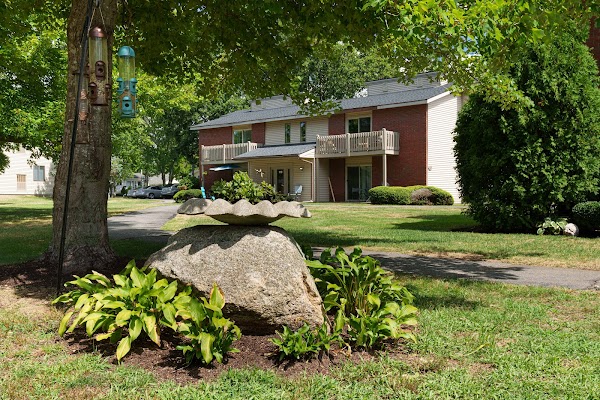
Hidden Brook Apartments
42 W Hill Rd, New Bedford, MA 02740, USA
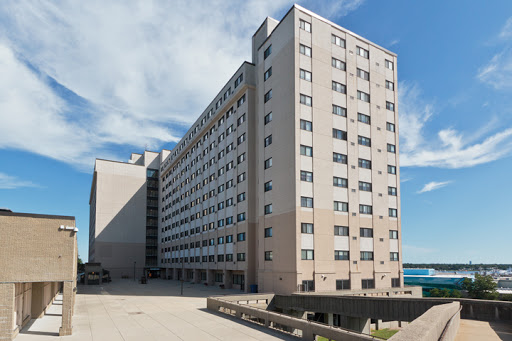
Melville Towers
850 Pleasant St #1, New Bedford, MA 02740, USA
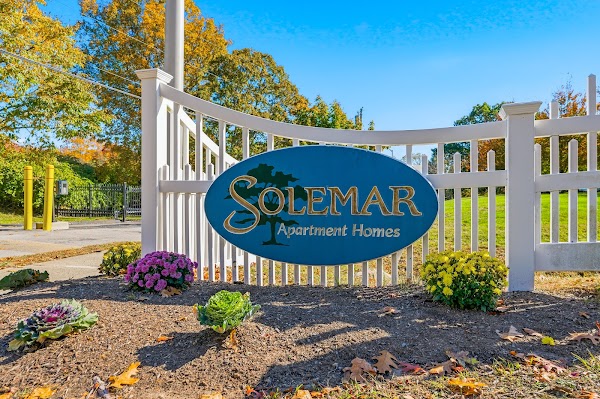
Solemar Apartments
26 Sea Breeze Dr, Dartmouth, MA 02748, USA
| # | Property | From | Avg | $/sqft | Rating | Units |
|---|---|---|---|---|---|---|
| 1 | Manomet Place 170 Riverside Ave, New Bedford, MA 02746, USA | $737 | $1,101 | $1.06 | 4.3 (16) | 73 |
| 2 | Amelia Apartments 676 Dartmouth St, Dartmouth, MA 02748, USA | -- | -- | -- | 3.2 (5) | 0 |
| 3 | Buttonwood Apartments 50 Oesting St, New Bedford, MA 02740, USA | -- | -- | -- | 3.8 (56) | 0 |
| 4 | Grinnell Mansion 379 County St, New Bedford, MA 02740, USA | -- | -- | -- | 4.4 (7) | 0 |
| 5 | Hidden Brook Apartments 42 W Hill Rd, New Bedford, MA 02740, USA | -- | -- | -- | 3.9 (55) | 0 |
| 6 | Melville Towers 850 Pleasant St #1, New Bedford, MA 02740, USA | -- | -- | -- | 3.4 (44) | 0 |
| 7 | Solemar Apartments 26 Sea Breeze Dr, Dartmouth, MA 02748, USA | -- | -- | -- | 4.5 (62) | 0 |
Explore Each Property

Manomet Place
4.3 (16)170 Riverside Ave, New Bedford, MA 02746, USA
Amelia Apartments
3.2 (5)676 Dartmouth St, Dartmouth, MA 02748, USA
Buttonwood Apartments
3.8 (56)50 Oesting St, New Bedford, MA 02740, USA

Grinnell Mansion
4.4 (7)379 County St, New Bedford, MA 02740, USA

Hidden Brook Apartments
3.9 (55)42 W Hill Rd, New Bedford, MA 02740, USA
Melville Towers
3.4 (44)850 Pleasant St #1, New Bedford, MA 02740, USA
New Bedford, MA Average Rent Prices 2026
The average rent in New Bedford, MA is $1,101 per month, based on 73 units across 7 apartment communities. Prices range from $737 at Manomet Place to $737 at Manomet Place.
Average Rent by Bedroom Type
| Type | Avg Rent | Starting From | Units |
|---|---|---|---|
| 1 Bed | $1,074/mo | $737/mo | 69 |
| 2 Bed | $1,571/mo | $1,028/mo | 4 |
Every price comes directly from each property's leasing system, updated that morning. Request a neighborhood we don't cover and we add it within 24 hours.
What salary do I need to live comfortably in New Bedford, MA?
Built on the 25 to 30 percent rent-to-income guideline used by most landlords and credit-scoring models.
Minimum to afford average rent
$44,000/year
30 percent rule -- using our average rent of $1,101/mo.
Comfortable income
$53,000/year
25 percent rule -- leaves more room for savings, transport, and groceries.
To afford the cheapest tracked apartment ($737/mo), you need to earn at least $29,000/year.
Cost of living in New Bedford, MA
We only have live rent data for New Bedford, MA so far. The full cost of living breakdown (utilities, groceries, transportation, healthcare) is coming soon.
| Category | Monthly estimate |
|---|---|
| Rent (market average) | $1,101 |
| Estimated total | $1,101/mo |
Methodology
Rent data
Sourced directly from each tracked apartment community and refreshed every 24 hours. Every listed unit price on this page is real and listed today.
Cost of living
Estimates combine national consumer-spending baselines from the U.S. Bureau of Labor Statistics (Consumer Expenditure Survey) with the U.S. Bureau of Economic Analysis Regional Price Parities (MARPP dataset). Both are peer-reviewed federal data releases published annually.
Salary to live comfortably
Applies the standard 25 to 30 percent rent-to-income rule on top of the listed rent. This is the same affordability guideline used by most landlords and credit-scoring models.
Demographic figures
Median household income, population, median age, commute time, Census median rent, and rent as percentage of income come from the U.S. Census Bureau's American Community Survey 5-year estimates, the most recent complete release.
Cost of living and demographic figures are refreshed annually.
Compare
Nearby cities in Massachusetts
How New Bedford, MA rent compares to other markets in the state.
| City | Avg Rent | vs New Bedford, MA | Properties |
|---|---|---|---|
| Boston, MA | $4,643 | +322% | 25 |
| Lynn, MA | $3,105 | +182% | 15 |
| Springfield, MA | $1,625 | +48% | 12 |
| Lawrence, MA | $2,935 | +167% | 11 |
| Quincy, MA | $2,805 | +155% | 8 |
| Lowell, MA | $1,578 | +43% | 8 |
Frequently asked questions
What is the average rent in New Bedford, MA?
The average rent in New Bedford, MA is $1,101 per month, based on 73 units across 7 apartment buildings tracked by Average Rent. Prices are updated every morning through our proprietary data sourcing.
What is the cheapest apartment rent in New Bedford, MA?
The lowest available rent in New Bedford, MA starts at $737 per month. Availability changes daily as leasing data is refreshed each morning.
How much is a 1-bedroom apartment in New Bedford, MA?
1-bedroom apartments in New Bedford, MA average $1,074/mo. The lowest listed 1-bedroom starts at $737/mo across 69 units tracked.
How much is a 2-bedroom apartment in New Bedford, MA?
2-bedroom apartments in New Bedford, MA average $1,571/mo. Units start from $1,028/mo across 4 units currently listed.
Rent Trends in New Bedford, MA
Track how apartment prices are changing over time.
Missing your neighborhood?
Tell us where you're looking. We'll start tracking prices within 24 hours.
Get Started