Average Rent in San Angelo, TX
11 apartment buildings, 90 units. Real asking prices, refreshed daily.
Avg Rent
$1,114/mo
market average
Cheapest
$609/mo
River Ranch Apartments
Properties
11
tracked daily
Units
90
available now
San Angelo, TX Resident Access
City Club members share insider gate codes, parking links, and amenity tips.
Analysis
Rent Price Breakdown
Compare pricing across all 11 properties in San Angelo, TX.
Average Rent by Property
Starting Price vs Average
Rent by Bedroom Count
Price per Square Foot
San Angelo, TX Rent Prices
All 11 properties ranked by lowest available rent.
River Ranch Apartments
4225 S Jackson St, San Angelo, TX 76903, USA
Plaza Square Apartments
4001 Sul Ross St, San Angelo, TX 76904, USA
Jackson Way Apartments
1818 S Lincoln St, San Angelo, TX 76904, USA
Sonterra West Apartments
3433 Arden Rd, San Angelo, TX 76901, USA
District 52 Apartments
2465 Harvard Ave, San Angelo, TX 76904, USA
Sedona Ranch Apartments
2901 Sunset Dr, San Angelo, TX 76904, USA
Sunset Apartments
1701 Sunset Dr, San Angelo, TX 76904, USA
| # | Property | From | Avg | $/sqft | Rating | Units |
|---|---|---|---|---|---|---|
| 1 | River Ranch Apartments 4225 S Jackson St, San Angelo, TX 76903, USA | $609 | $672 | $0.67 | 3.6 (201) | 2 |
| 2 | Plaza Square Apartments 4001 Sul Ross St, San Angelo, TX 76904, USA | $779 | $1,020 | $1.29 | 4.4 (207) | 20 |
| 3 | Jackson Way Apartments 1818 S Lincoln St, San Angelo, TX 76904, USA | $799 | $977 | $1.65 | 4.3 (36) | 6 |
| 4 | Sonterra West Apartments 3433 Arden Rd, San Angelo, TX 76901, USA | $850 | $933 | $1.61 | 4.6 (115) | 7 |
| 5 | District 52 Apartments 2465 Harvard Ave, San Angelo, TX 76904, USA | $859 | $859 | $1.17 | 4.5 (14) | 1 |
| 6 | Sedona Ranch Apartments 2901 Sunset Dr, San Angelo, TX 76904, USA | $923 | $998 | $1.18 | 4.1 (302) | 15 |
| 7 | Sunset Apartments 1701 Sunset Dr, San Angelo, TX 76904, USA | $995 | $1,132 | $1.37 | 4.4 (218) | 11 |
Explore Each Property
River Ranch Apartments
3.6 (201)4225 S Jackson St, San Angelo, TX 76903, USA
Plaza Square Apartments
4.4 (207)4001 Sul Ross St, San Angelo, TX 76904, USA
Jackson Way Apartments
4.3 (36)1818 S Lincoln St, San Angelo, TX 76904, USA
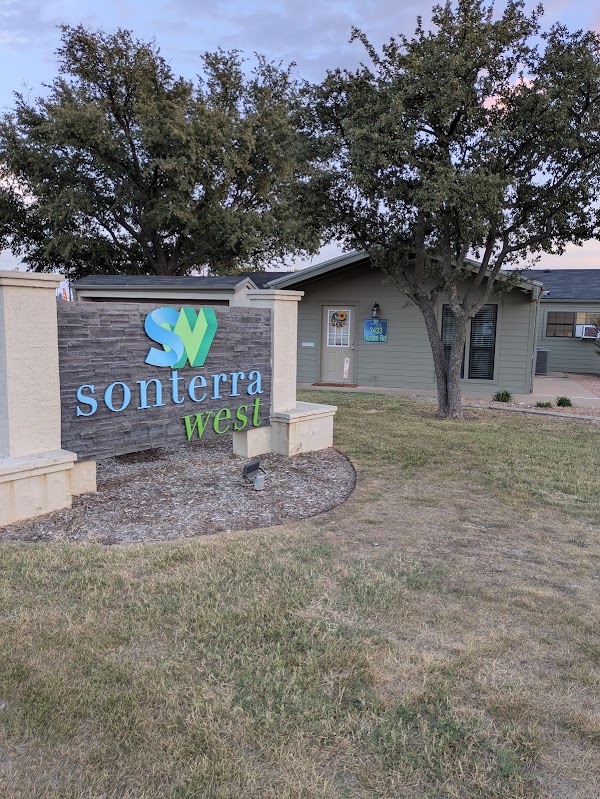
Sonterra West Apartments
4.6 (115)3433 Arden Rd, San Angelo, TX 76901, USA
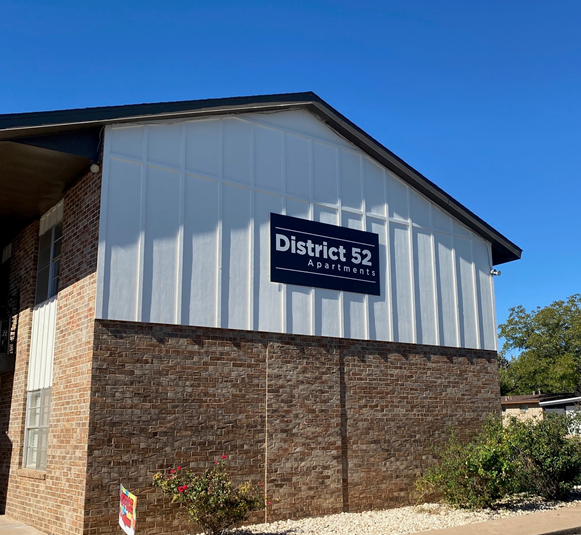
District 52 Apartments
4.5 (14)2465 Harvard Ave, San Angelo, TX 76904, USA
Sedona Ranch Apartments
4.1 (302)2901 Sunset Dr, San Angelo, TX 76904, USA
San Angelo, TX Average Rent Prices 2026
The average rent in San Angelo, TX is $1,114 per month, based on 90 units across 11 apartment communities. Prices range from $609 at River Ranch Apartments to $1,514 at Creekside Apartments.
Average Rent by Bedroom Type
| Type | Avg Rent | Starting From | Units |
|---|---|---|---|
| Studio | $1,000/mo | $799/mo | 2 |
| 1 Bed | $995/mo | $779/mo | 41 |
| 2 Bed | $1,207/mo | $735/mo | 42 |
| 3 Bed | $1,348/mo | $609/mo | 5 |
Every price is a real asking rent, updated that morning. Request a neighborhood we don't cover and we add it within 24 hours.
What salary do I need to live comfortably in San Angelo, TX?
Built on the 25 to 30 percent rent-to-income guideline used by most landlords and credit-scoring models.
Minimum to afford average rent
$45,000/year
Based on the 30 percent rule, using our tracked average rent of $1,114/mo.
Comfortable income
$53,000/year
Based on the 25 percent rule, leaving more room for savings, transport, and groceries.
To afford the cheapest tracked apartment ($609/mo), you need to earn at least $24,000/year.
Cost of living in San Angelo, TX
We only have live rent data for San Angelo, TX so far. The full cost of living breakdown (utilities, groceries, transportation, healthcare) is coming soon.
| Category | Monthly estimate |
|---|---|
| Rent (market average) | $1,114 |
| Estimated total | $1,114/mo |
Methodology
Rent data
Sourced directly from each tracked apartment community and refreshed every 24 hours. Every listed unit price on this page is real and listed today.
Cost of living
Estimates combine national consumer-spending baselines from the U.S. Bureau of Labor Statistics (Consumer Expenditure Survey) with the U.S. Bureau of Economic Analysis Regional Price Parities (MARPP dataset). Both are peer-reviewed federal data releases published annually.
Salary to live comfortably
Applies the standard 25 to 30 percent rent-to-income rule on top of the listed rent. This is the same affordability guideline used by most landlords and credit-scoring models.
Demographic figures
Median household income, population, median age, commute time, Census median rent, and rent as percentage of income come from the U.S. Census Bureau's American Community Survey 5-year estimates, the most recent complete release.
Cost of living and demographic figures are refreshed annually.
Compare
Nearby cities in Texas
How San Angelo, TX rent compares to other markets in the state.
| City | Avg Rent | vs San Angelo, TX | Properties |
|---|---|---|---|
| Addison, TX | $1,614 | +45% | 311 |
| Austin, TX | $2,025 | +82% | 188 |
| Dallas, TX | $1,824 | +64% | 160 |
| Houston, TX | $2,265 | +103% | 72 |
| Lewisville, TX | $1,585 | +42% | 54 |
| Arlington, TX | $1,396 | +25% | 54 |
Frequently asked questions
What is the average rent in San Angelo, TX?
The average rent in San Angelo, TX is $1,114 per month, based on 90 units across 11 apartment buildings tracked by Average Rent. Prices are refreshed daily.
What is the cheapest apartment rent in San Angelo, TX?
The lowest available rent in San Angelo, TX starts at $609 per month. Availability changes daily and prices are refreshed each morning.
How much is a 1-bedroom apartment in San Angelo, TX?
1-bedroom apartments in San Angelo, TX average $995/mo. The lowest listed 1-bedroom starts at $779/mo across 41 units tracked.
How much is a 2-bedroom apartment in San Angelo, TX?
2-bedroom apartments in San Angelo, TX average $1,207/mo. Units start from $735/mo across 42 units currently listed.
Rent Trends in San Angelo, TX
Track how apartment prices are changing over time.
Missing your neighborhood?
Tell us where you're looking. We'll start tracking prices within 24 hours.
Get Started